Case 03 of 04 · HashiCorp · 2025

The 2025 Cloud Complexity Report

A 60-asset campaign that turned a third-party survey into HashiCorp's most-cited source of truth on cloud infrastructure.

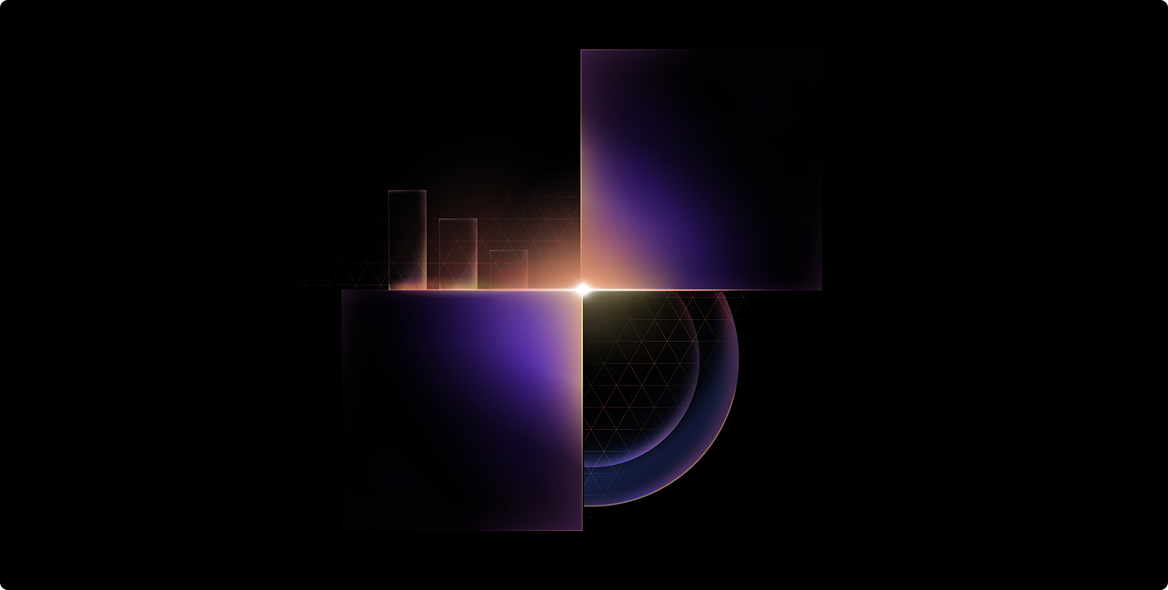
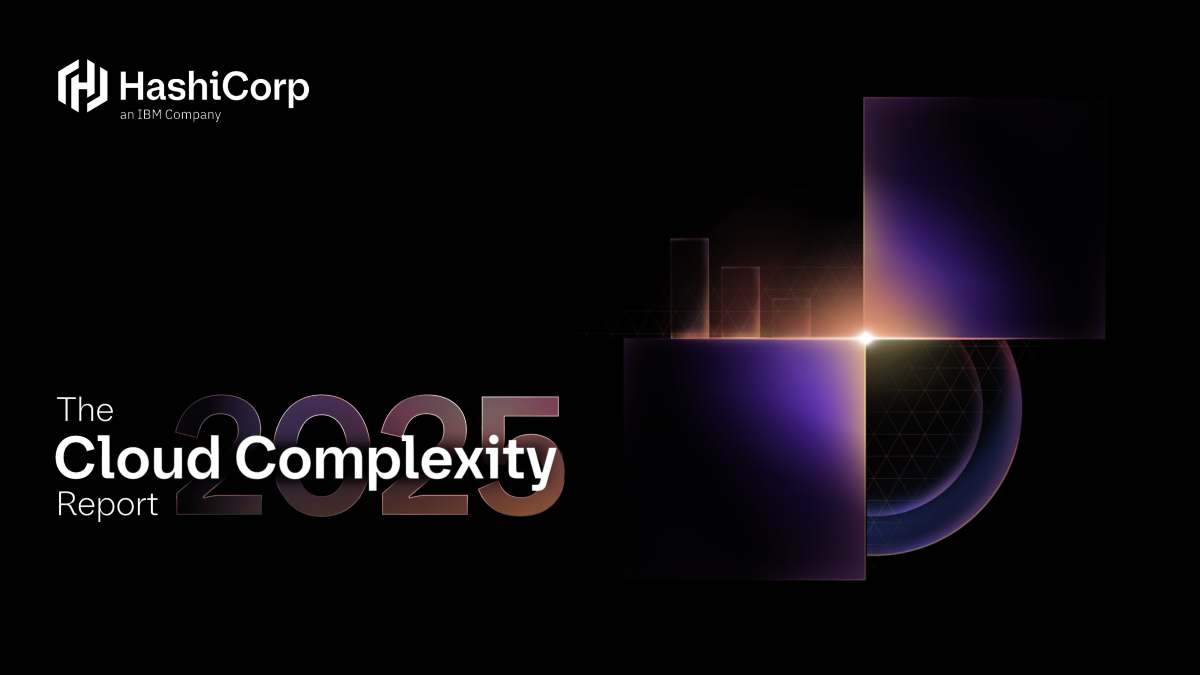
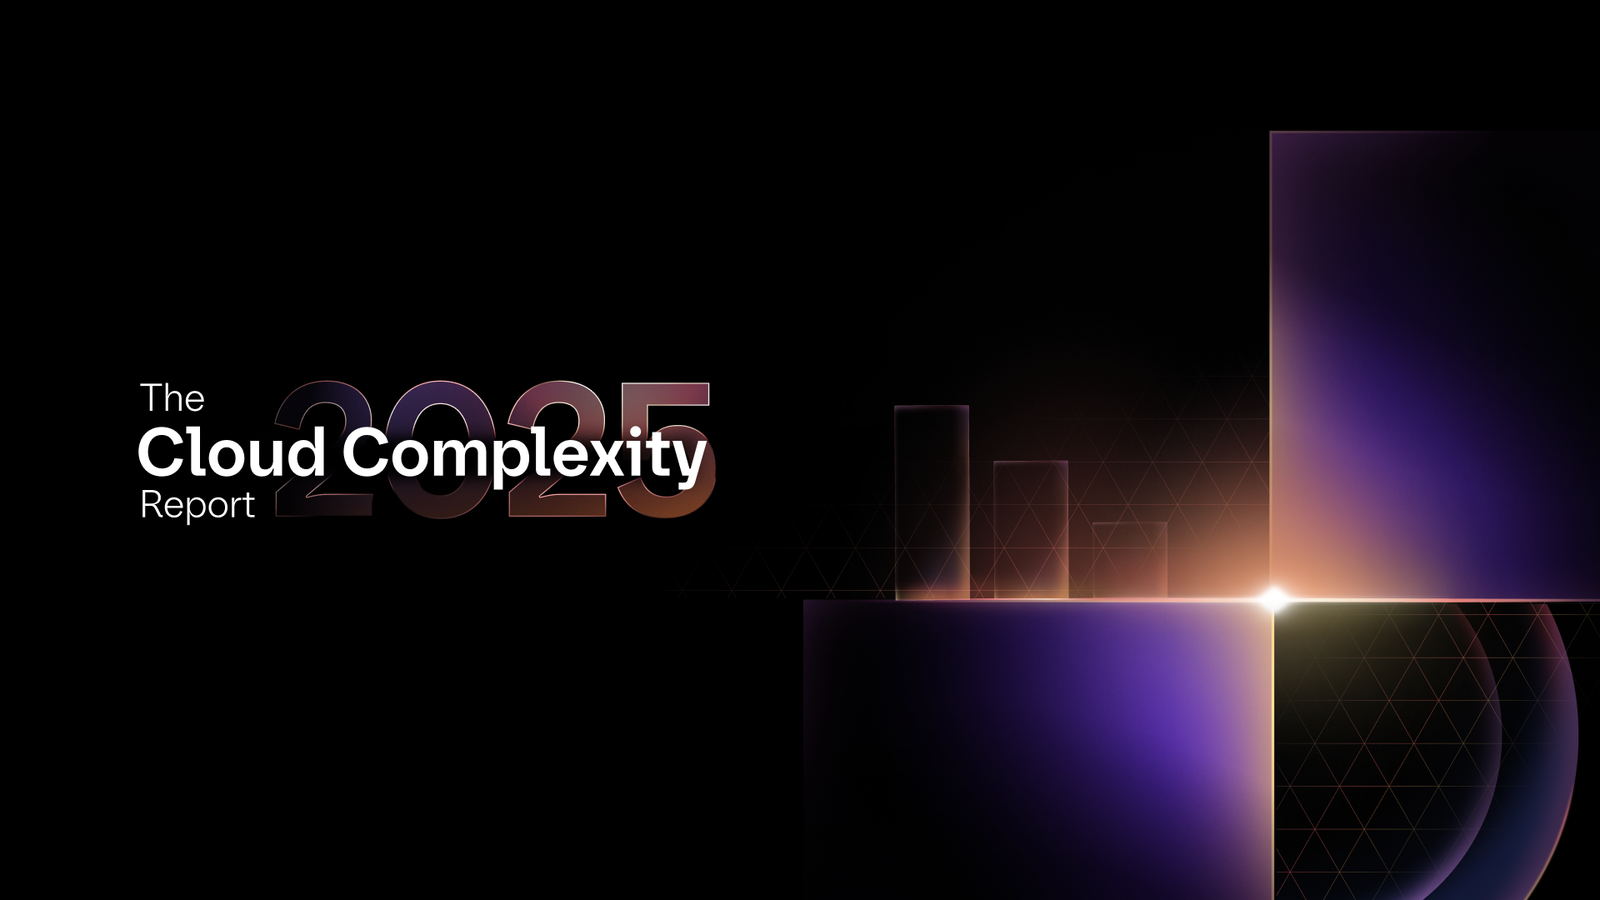
The 2025 Cloud Complexity Report key art
ClientHashiCorp
RoleArt Director · Lead designer
TeamBrand, PMM, Videography, SE, External motion vendor
Timeline1.5 Months
ToolsFigma, InDesign, After effects, Powerpoint
60assets delivered across the campaign
11distinct asset types
190verified B2B leads generated

Problem + Context

HashiCorp’s annual “State of the Cloud” report was a repeatedly missed opportunity to drive conversions, build trust, and reach a global audience. Non-English readers had never had access to it at all, leaving significant business on the table. Over ~1 month with Marketing, I turned Forrester’s data into an integrated campaign with multi-lingual support across 5 regions. I led art direction and executed nearly the entire bill of materials, with Figma as the source of truth and the report laid out in InDesign. We also reshaped the core message to fit the current market, renaming it from “The State of the Cloud” to “The Cloud Complexity Report.”

The key decision.

Leveraging recent direction

The visual styling needed to clearly harken to where the brand was, while maintaining a sense of originality in its assembly. I used the key art I’d developed with the brand team earlier in the year for our integrated campaigns as a starting point. Glassy surfaces that are suffused with light, hinting at greater complexities within. Breaking down the key art into reusable pieces allowed me to see it as a proper system and identify new relationships that we could leverage with the core message.
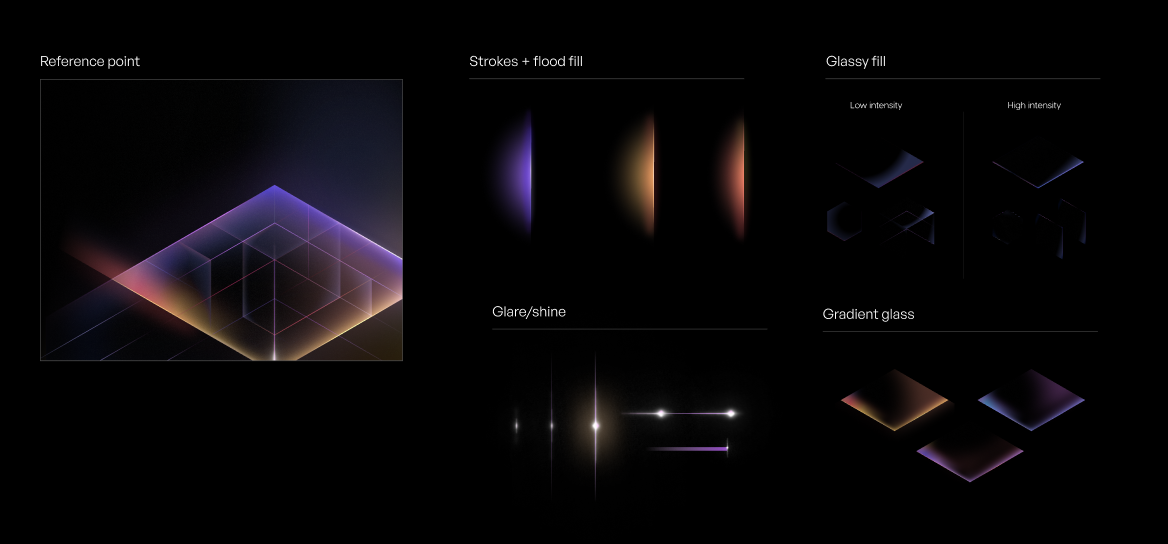
Shape-and-light reference toolkit — glassy surfaces, strokes, flood fill, glare, and gradient glass

How I built it.

01

Finding the right relationship

The isometric stylings pulled from the reference over complicated the messaging and stepped too far away from the data viz suggestion that I was aiming for. I found much greater success in 2d shapes that were truly emblematic of the charts and data that would be showcased across the campaign. Donuts, bars, blocks, all basic forms but their relationships can be made to feel complex, just like the data they represent. These basic building blocks were flexible, but finding the point of focus, where data meets need was the focus of these iterations. I landed on a solution of a pinpoint of light emerging from where core shapes touched, a moment of clarity in the confusion and complexity of the cloud, a guiding light.

Shape and light study 1
Shape and light study 2
Shape and light study 3
Shape and light study 4
Shape and light study 5
Shape and light study 6
Shape and light study 7
Shape and light study 8

Final key art — Variant 1

Final key art — variant 1

Final key art — Variant 2

Final key art — variant 2
02

Differentiation via branding

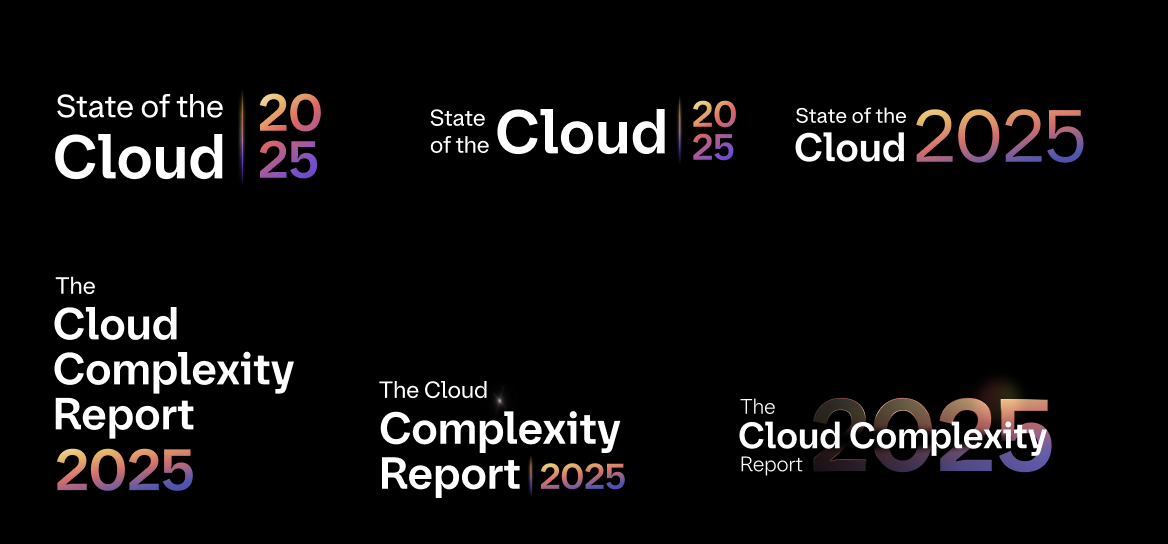
To help set this campaign apart from our typical comms, I developed a brand mark for key assets. Initially this had been built on the “State of the Cloud” name before it was changed, but as the colors/treatments had already been solidified and documented, this wasn’t a major lift.

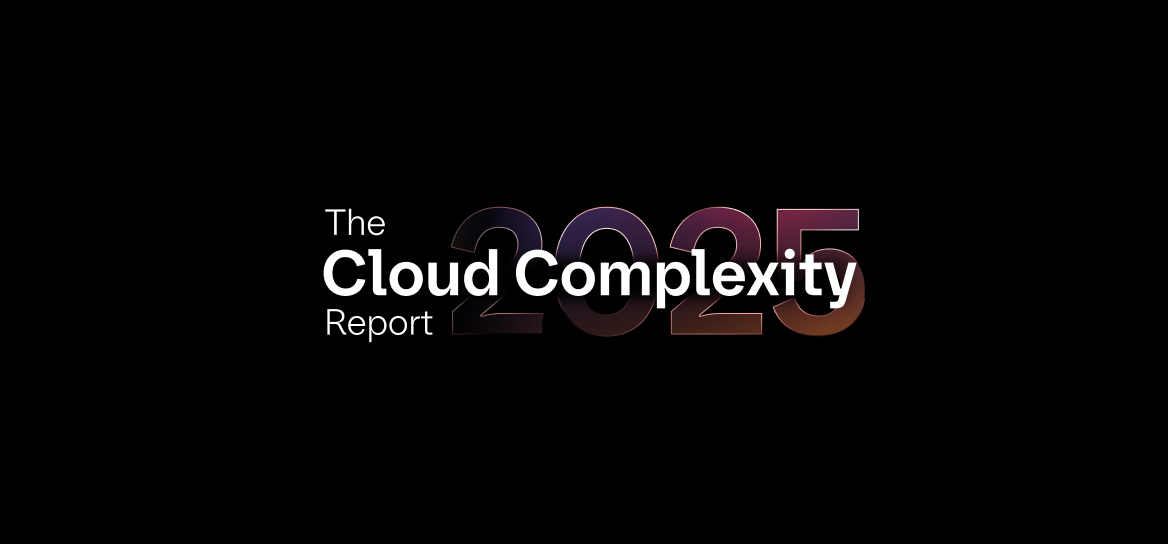
The Cloud Complexity Report 2025 lockup
State of the Cloud 2025 lockup
Old New
03

A modular grid for the report.

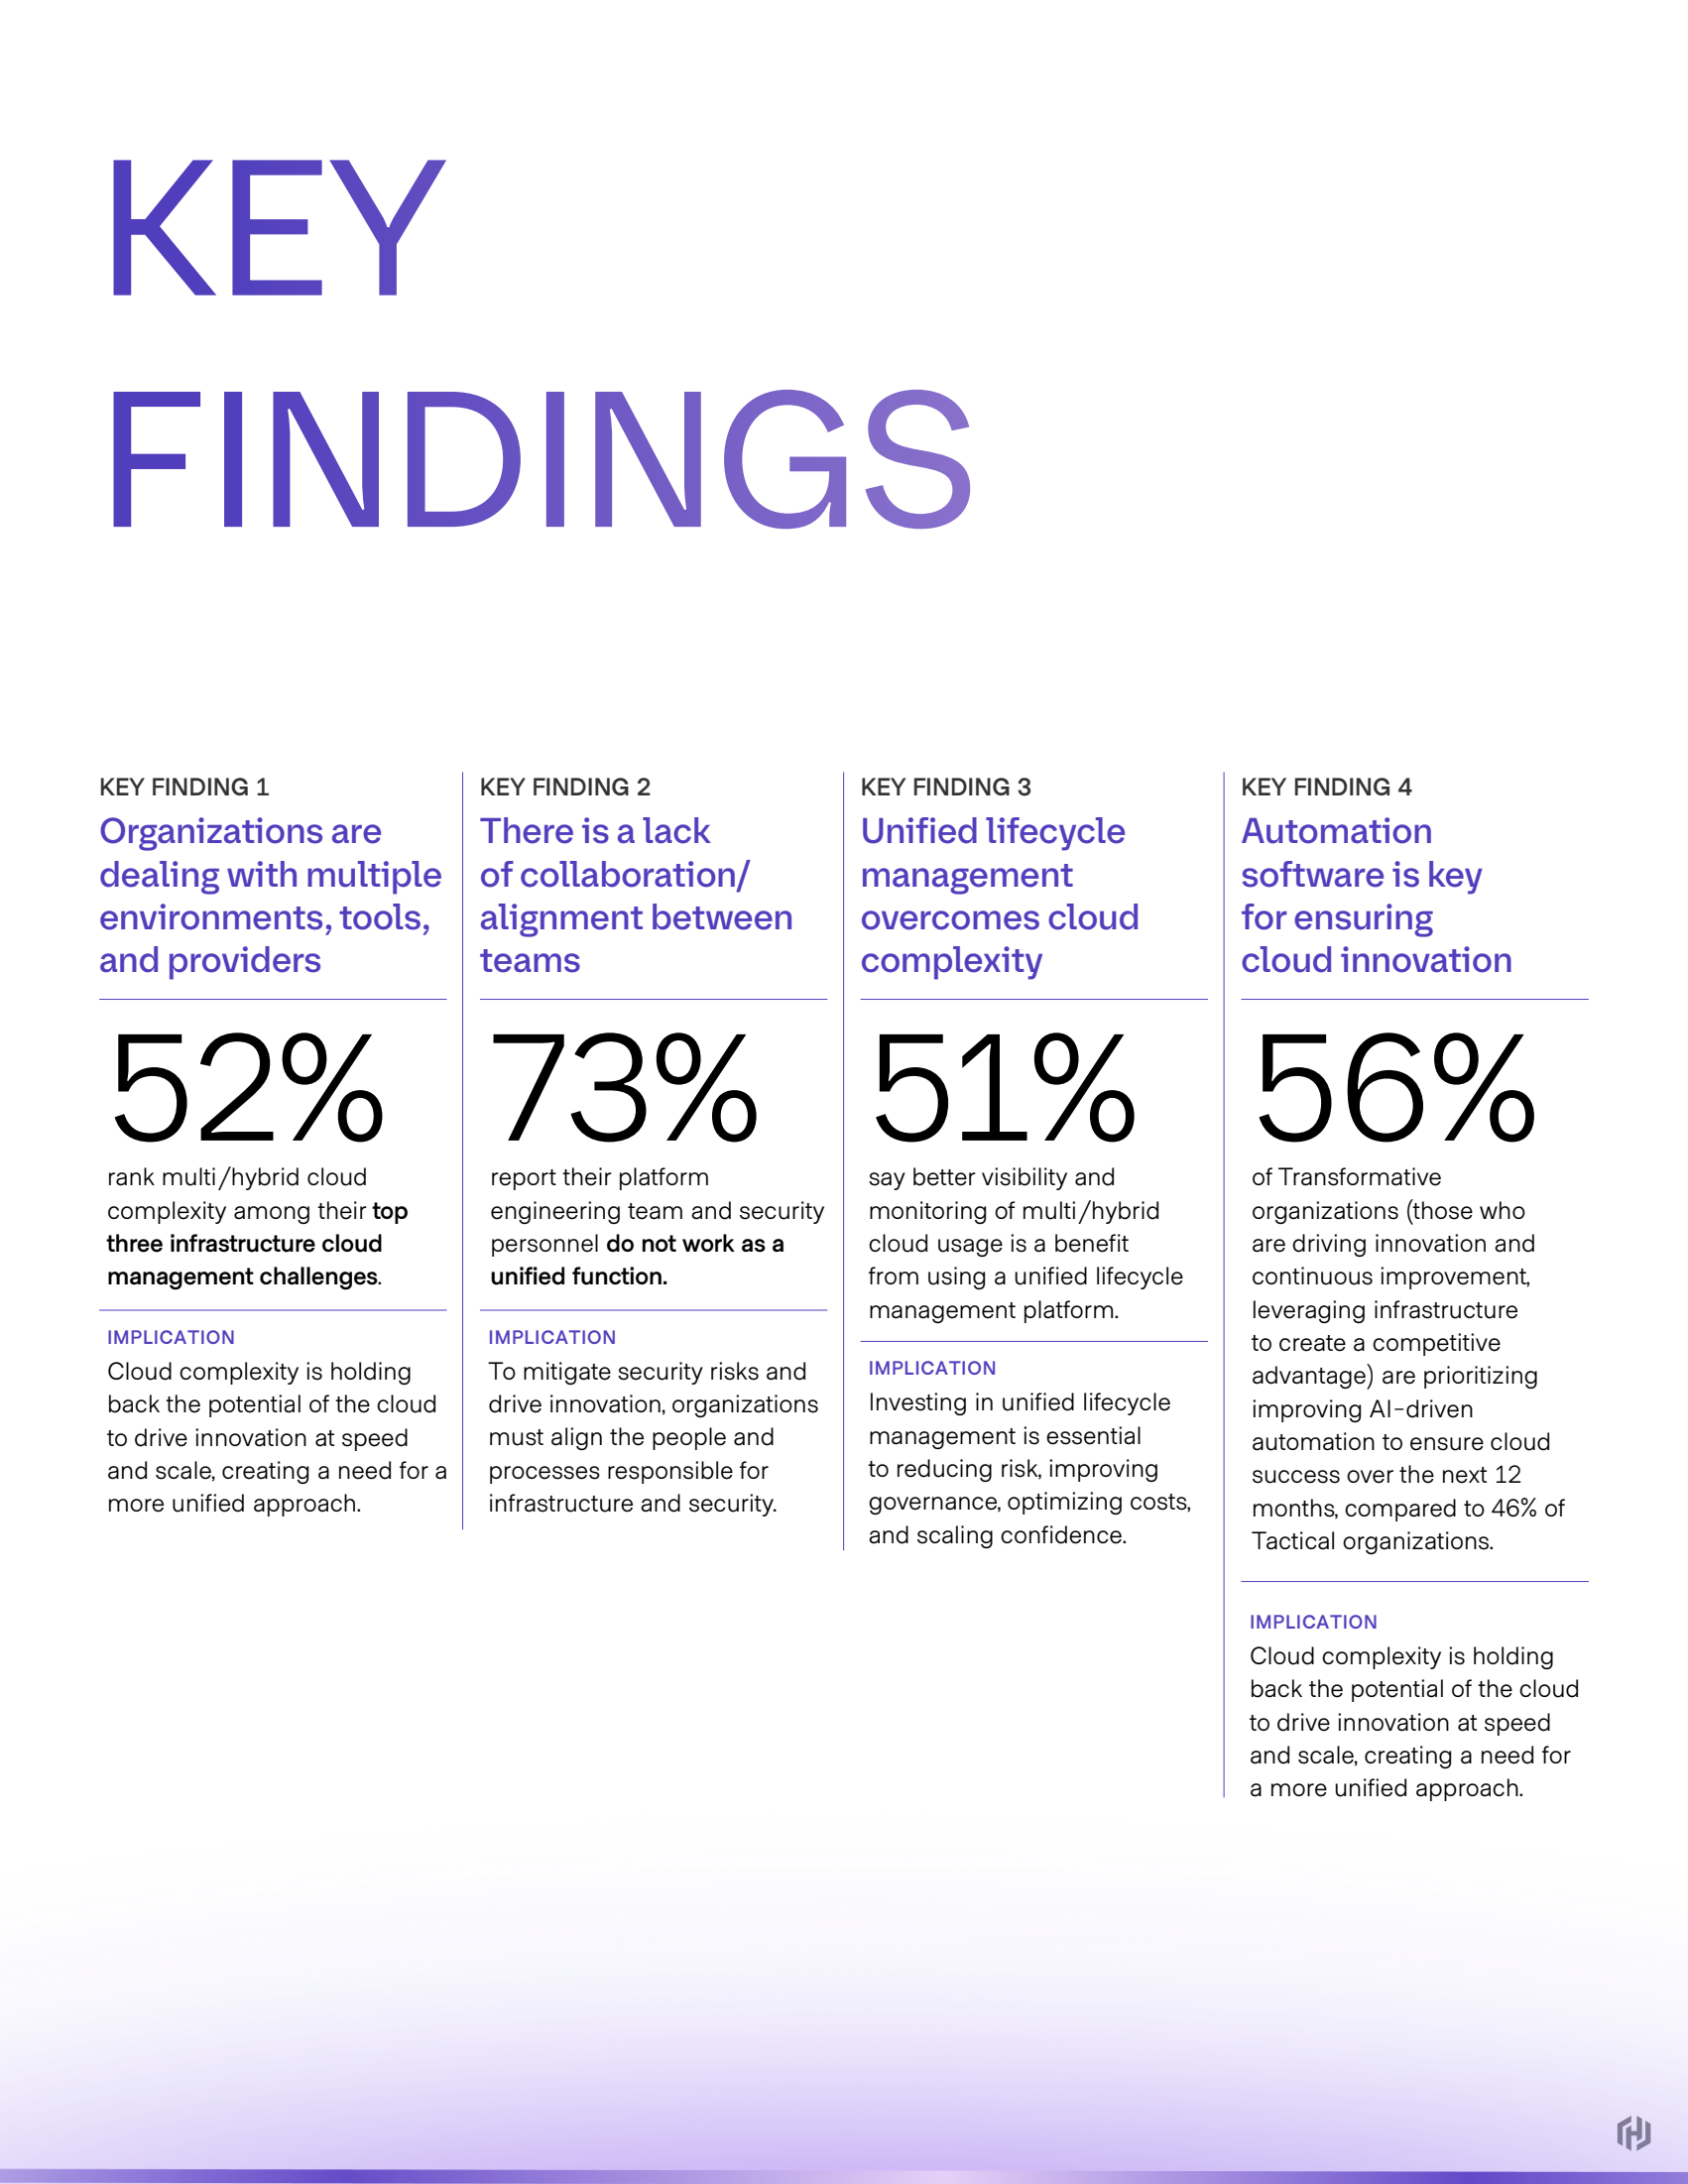
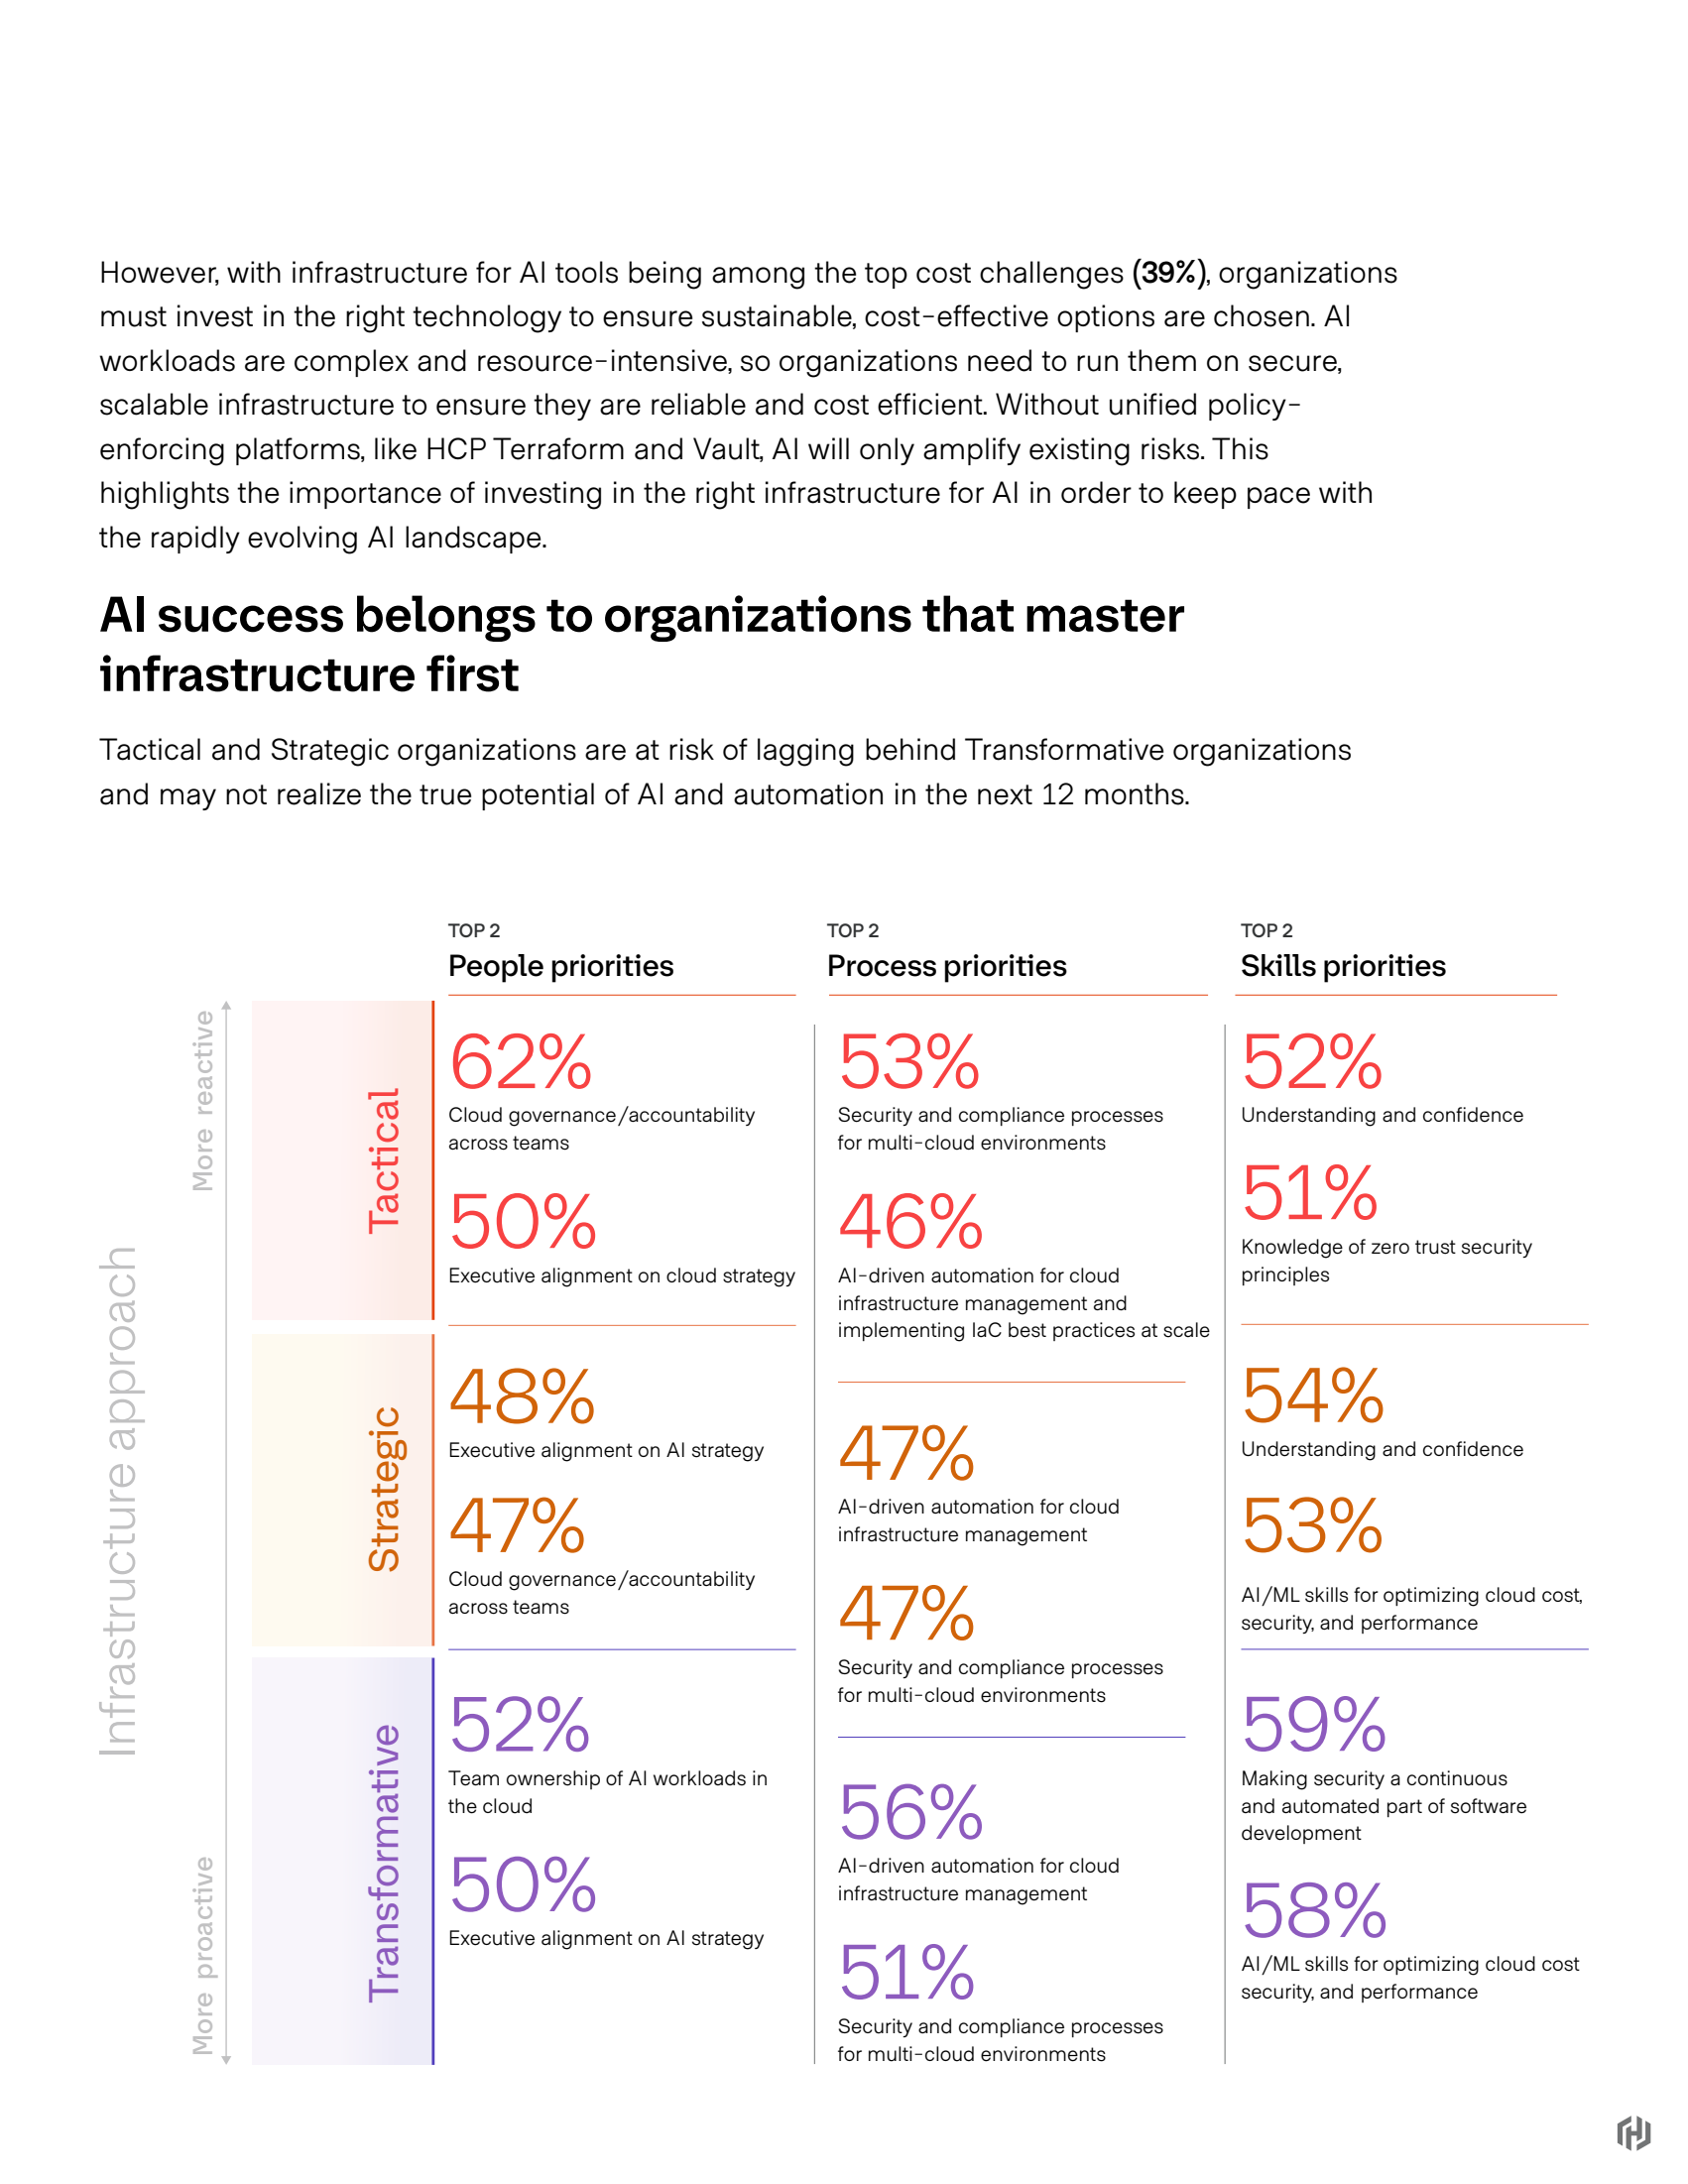
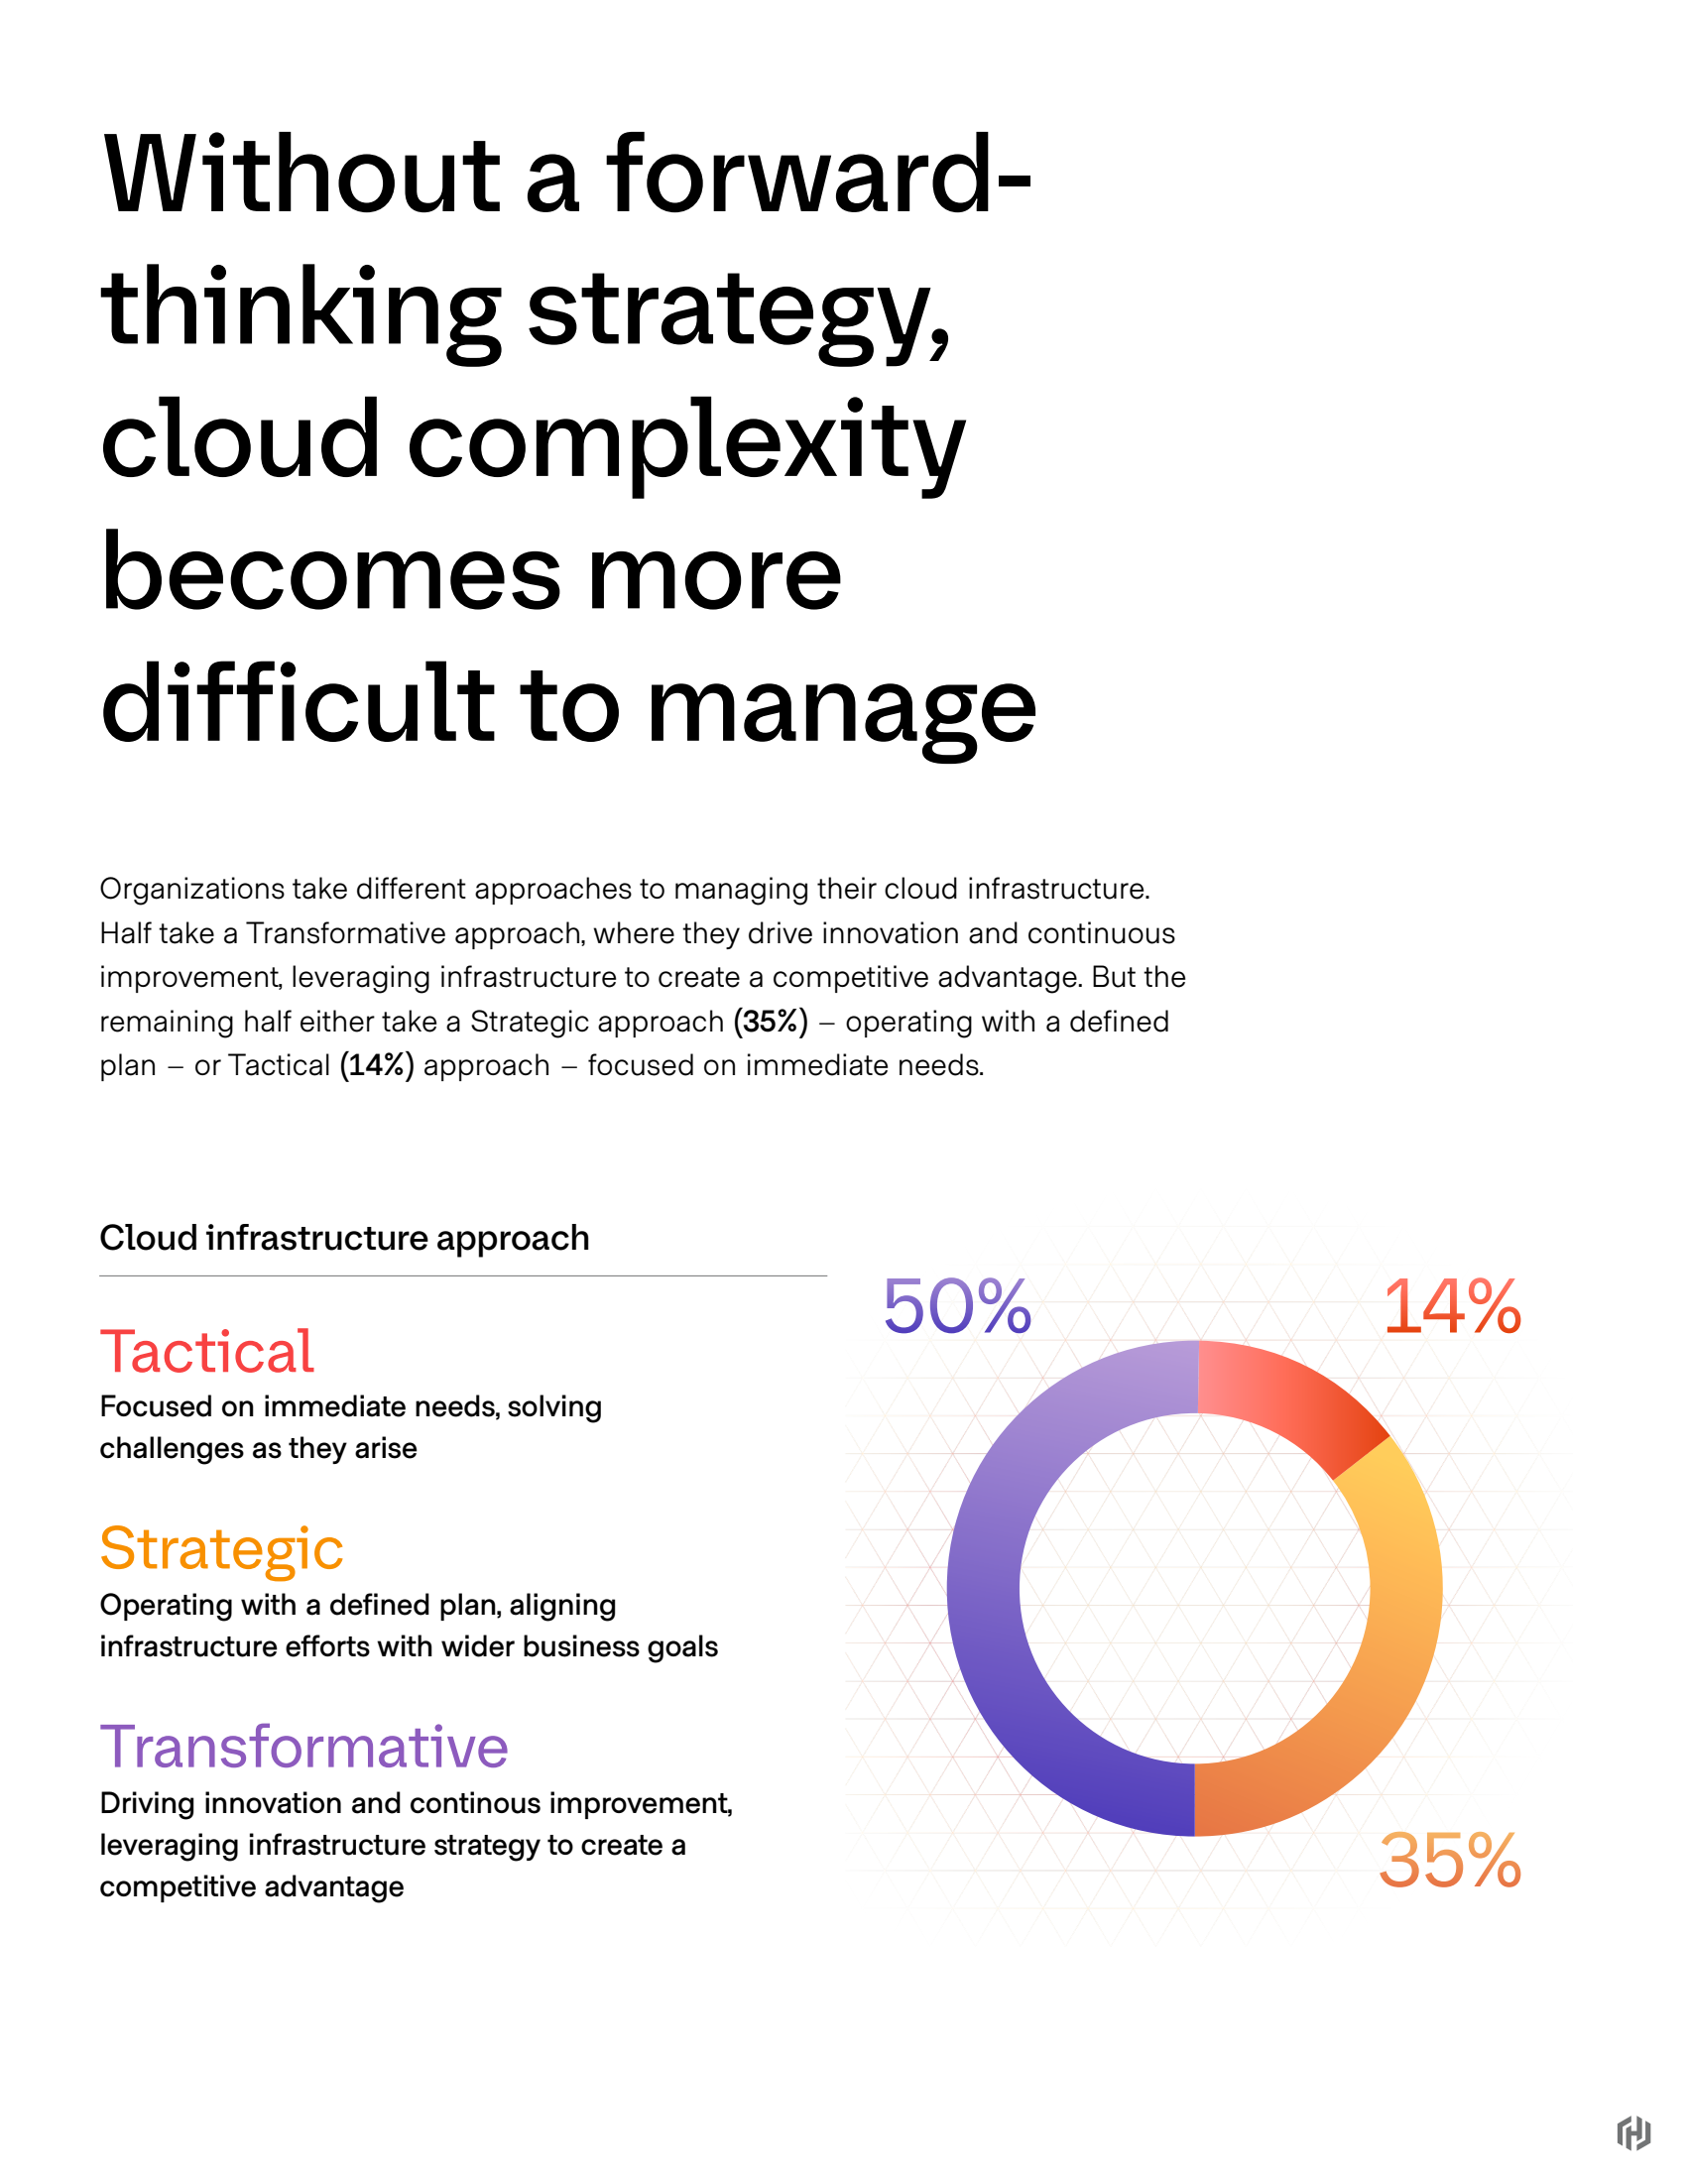
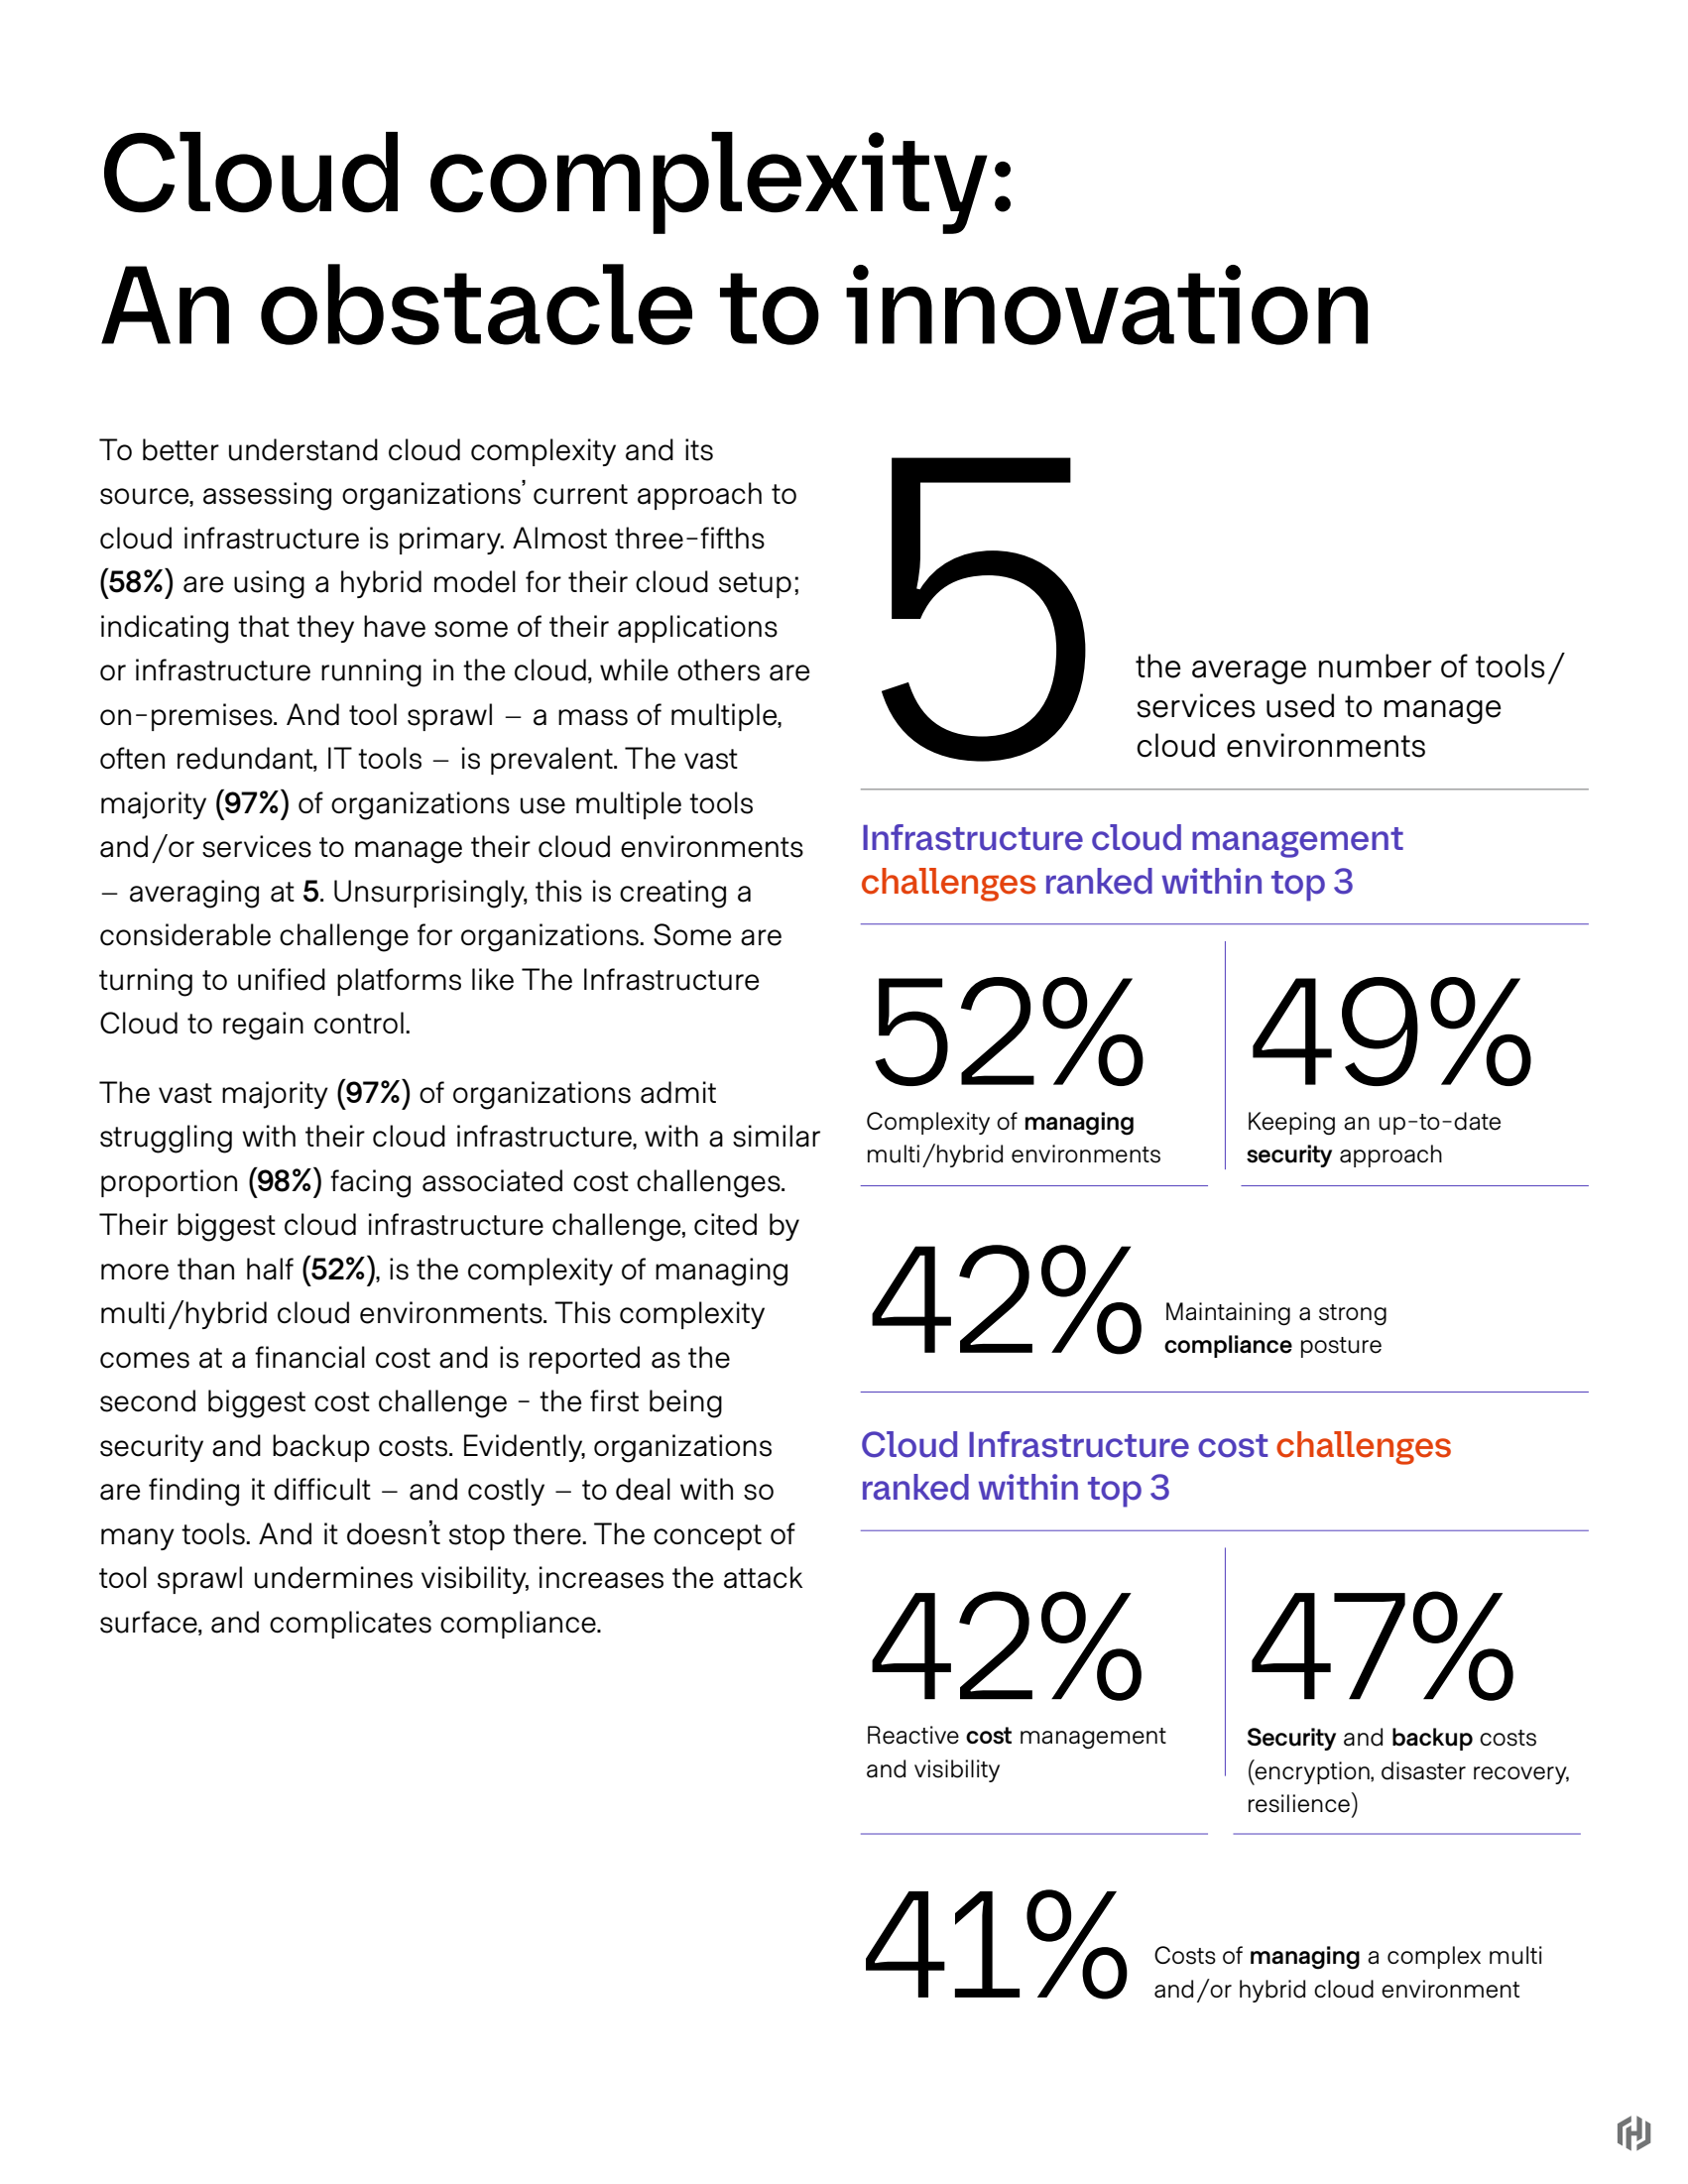
The report’s content was somewhat in flux, but we needed multiple ways to potentially present data. This modular setup allowed varieties of density that could be read horizontally and vertically, while drawing focus to what we considered to be the core takeaways.

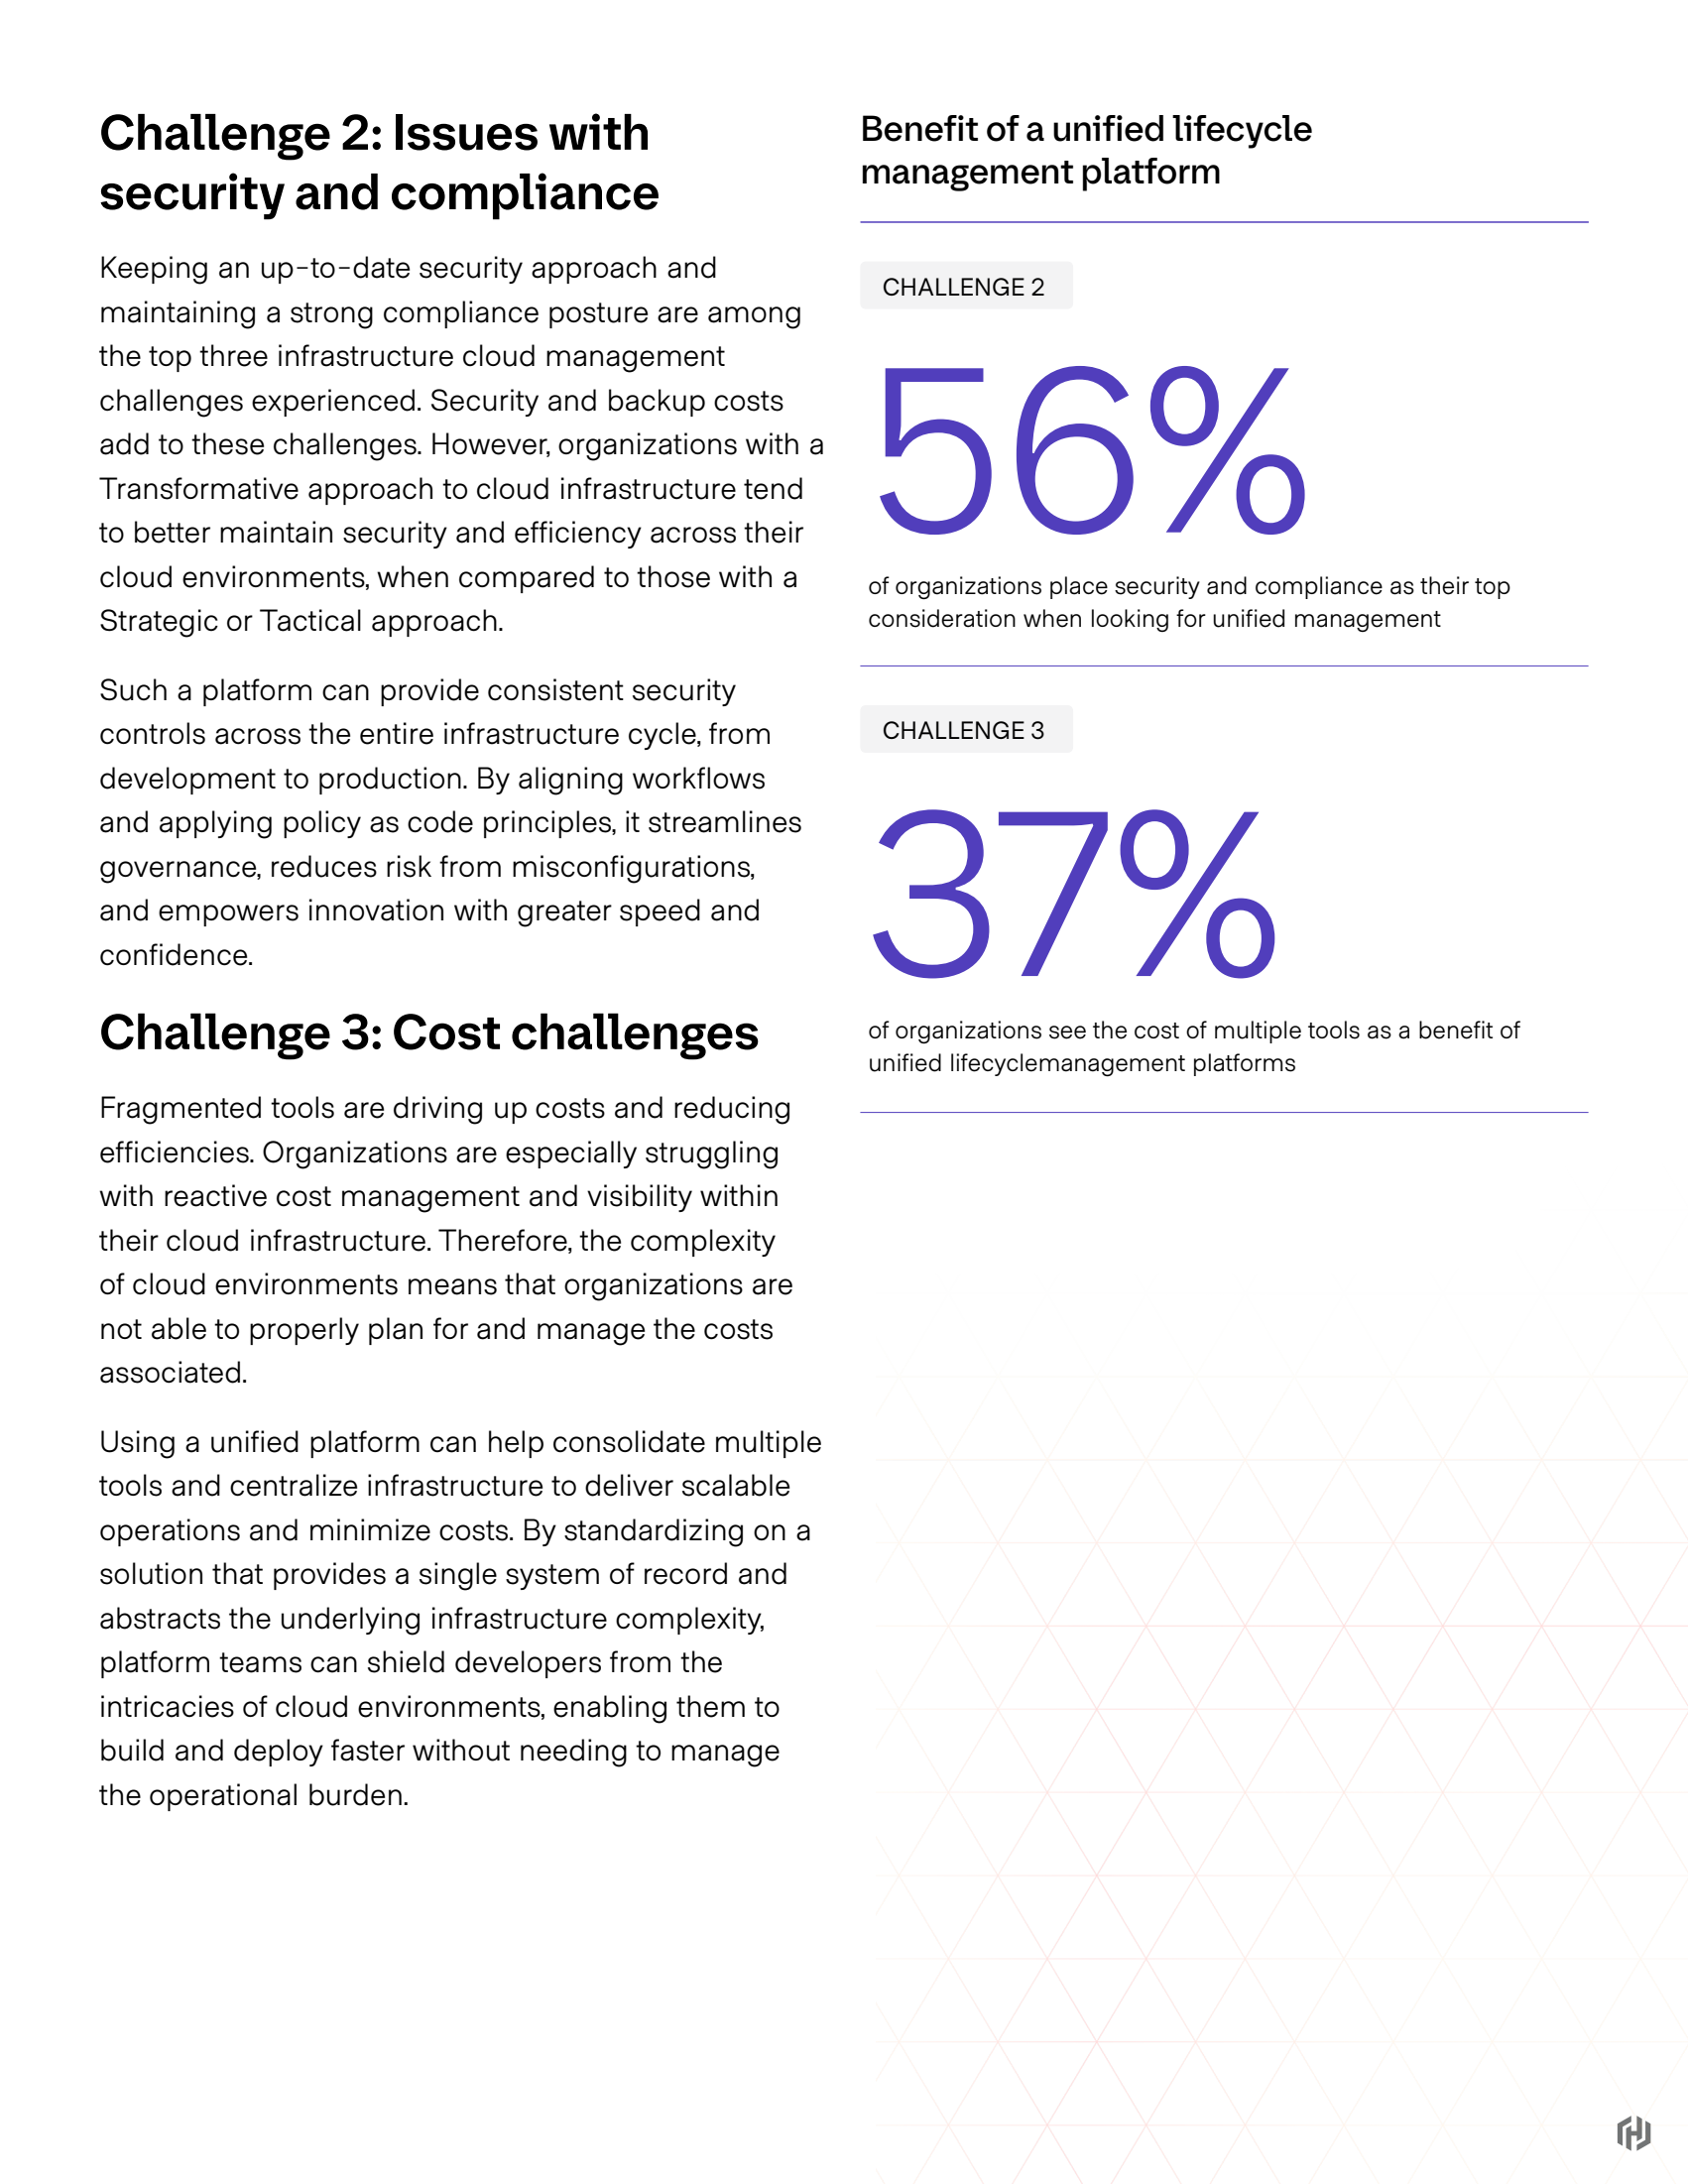
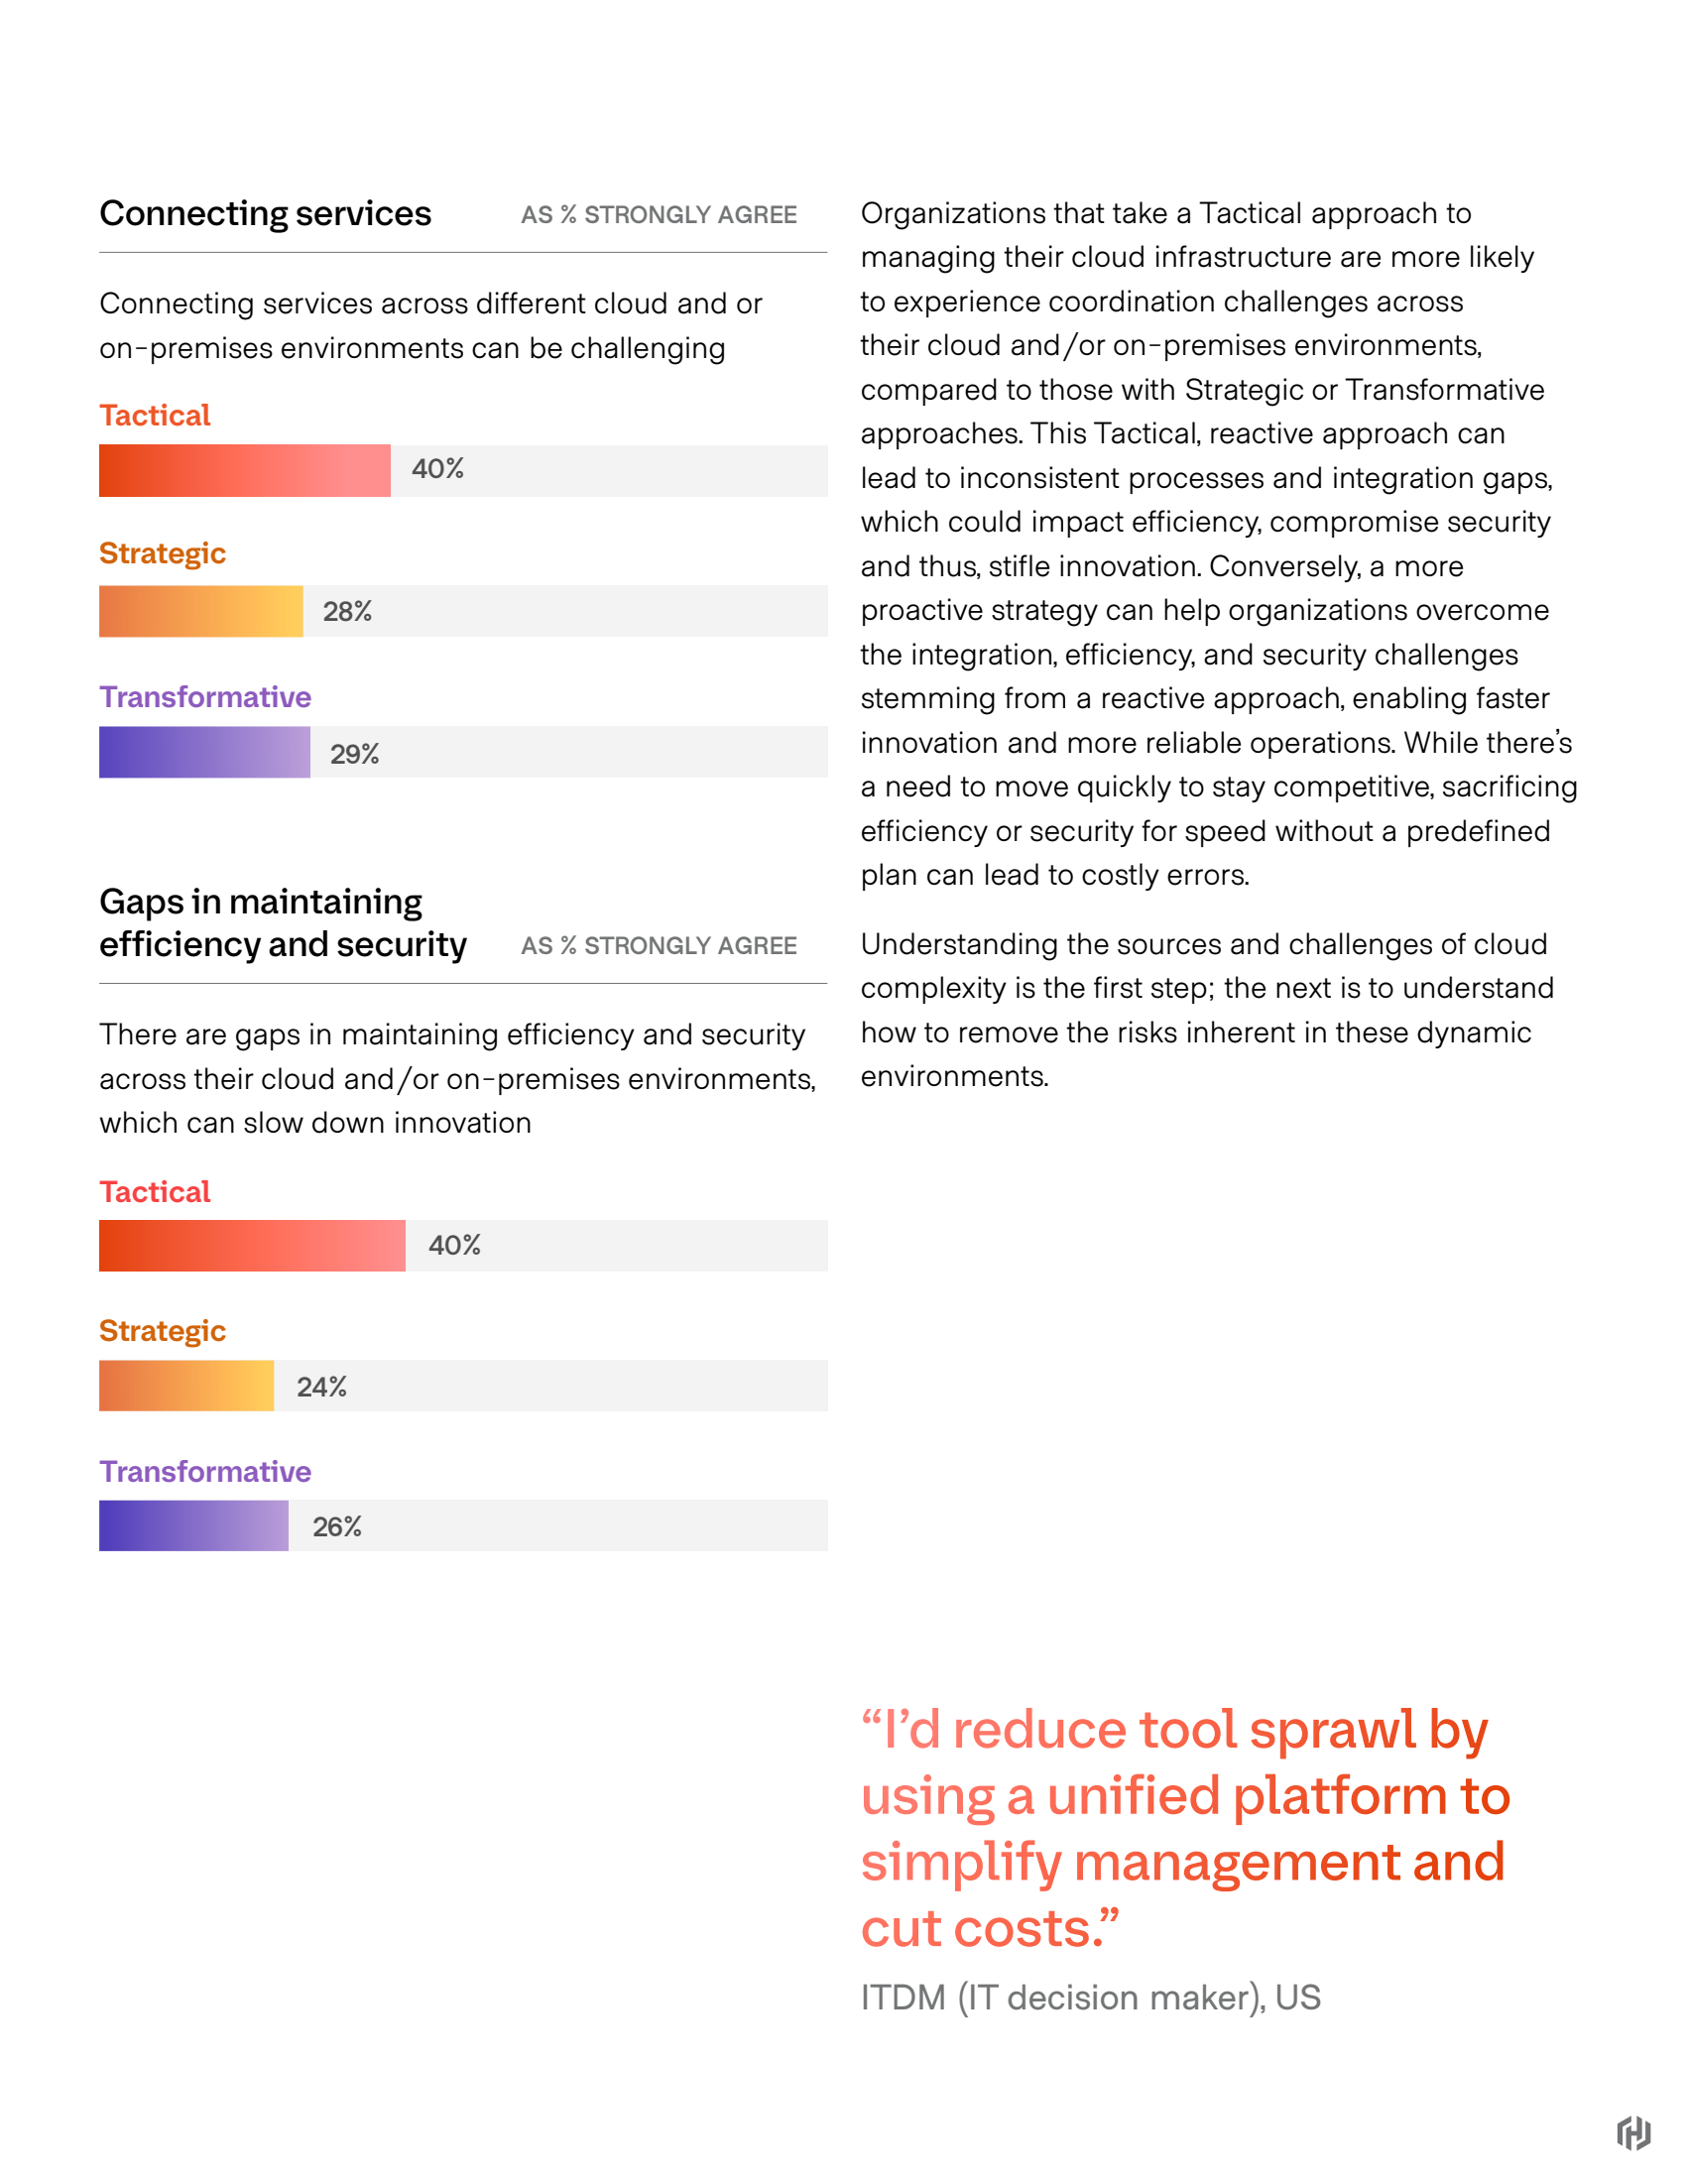
Report page 05
Report page 17
Report page 08
Report page 06
Report page 14
Report page 09
04

Extension by video/motion

I worked with our videographer and an external vendor, providing triage and design feedback on a youtube video and a pair of motion assets for organic social.

Watch the Cloud Complexity Report overview on YouTube

Youtube overview

Thumb/cover and background were designed for our videographer.

Motion

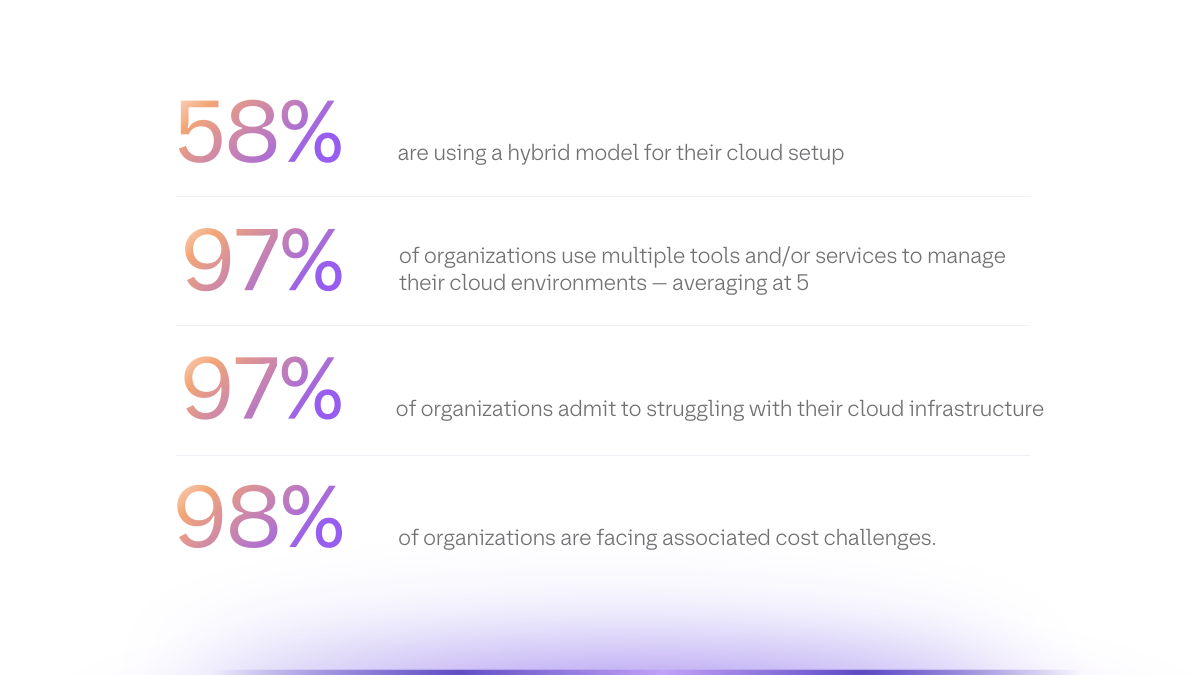
1 of 2 fifteen second motion pieces for organic social, using the defined system

05

Delivered as a pitch.

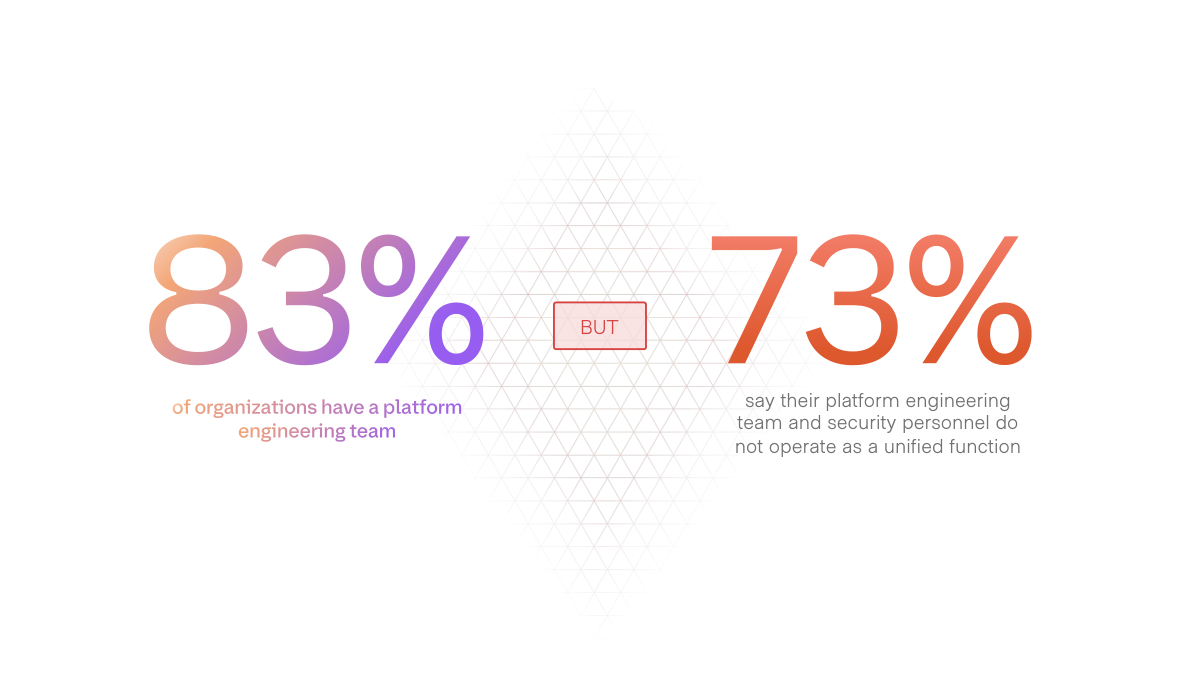
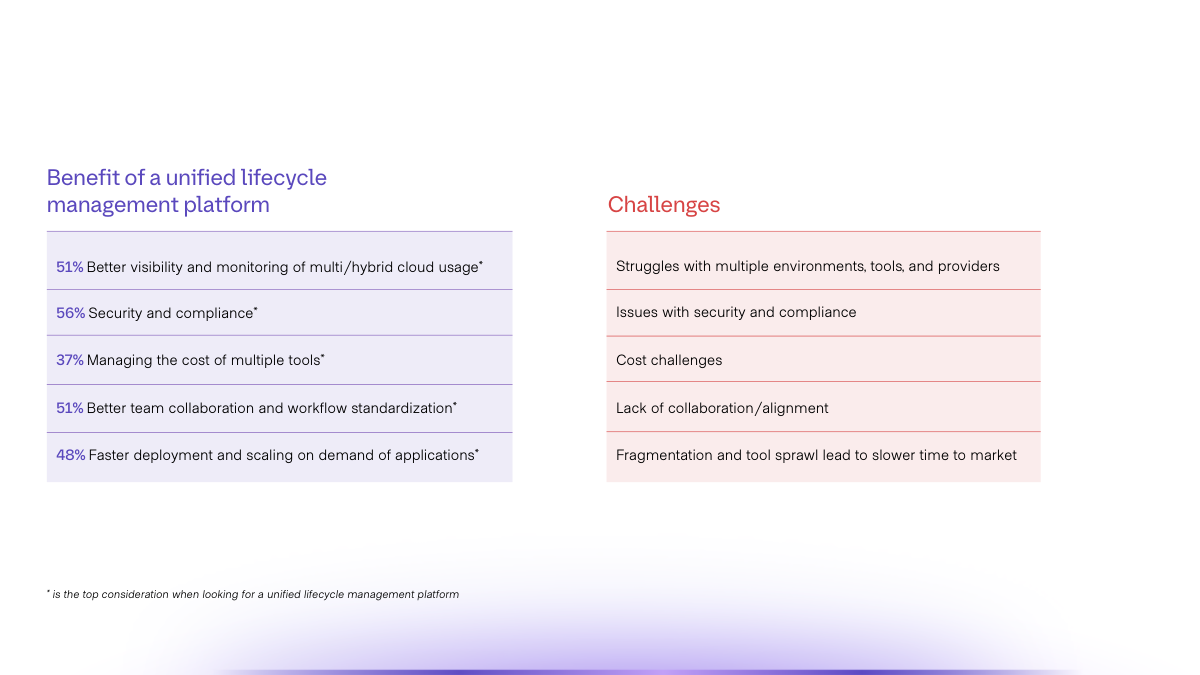
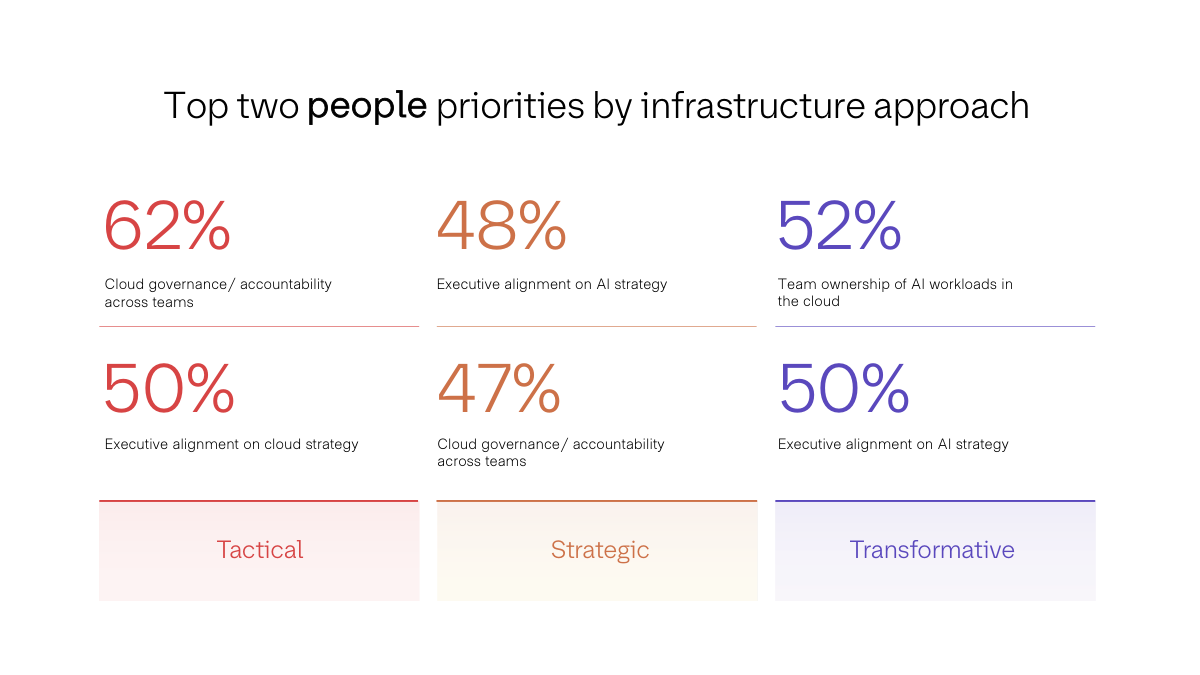
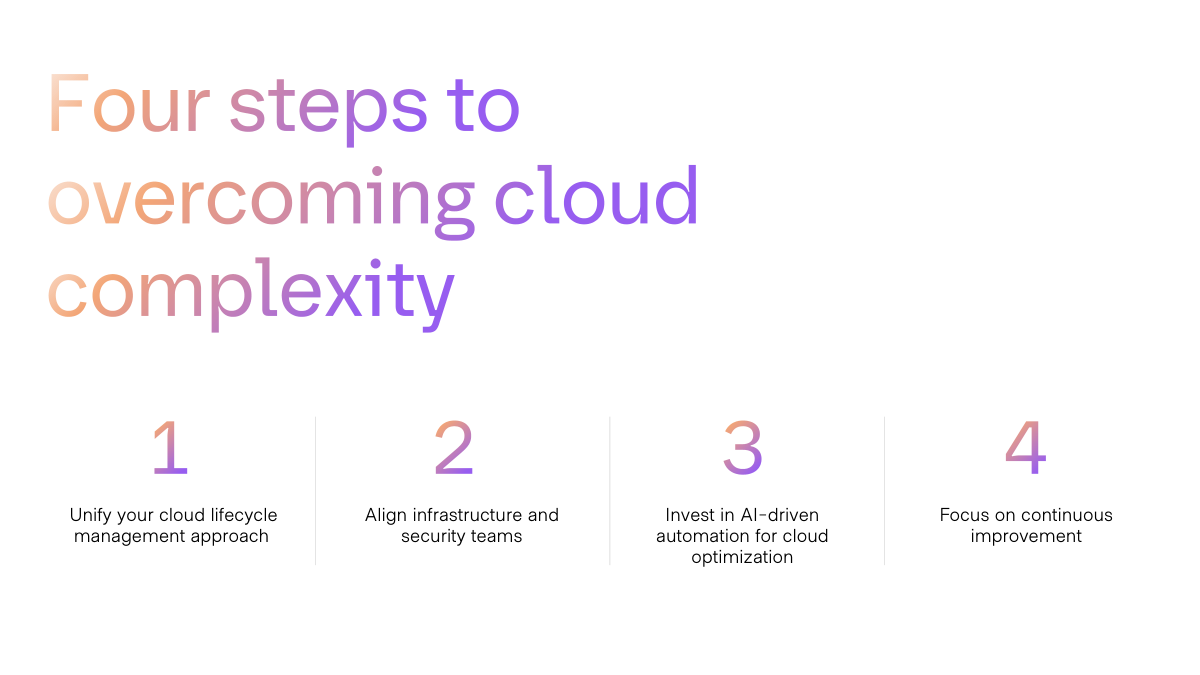
The campaign landed as a 19-page sales deck the field team walked through with prospects. All the same treatments for the report are present, just tuned for the particular format to keep the experience cohesive

Deck spreads — 6 of 19

Deck spread 1
Deck spread 2
Deck spread 3
Deck spread 4
Deck spread 5
Deck spread 6
06

Everything else the system did.

The campaign also had to land on the marketing site, in inboxes, on social, with key art that was consistent, but flexible and scaled well.

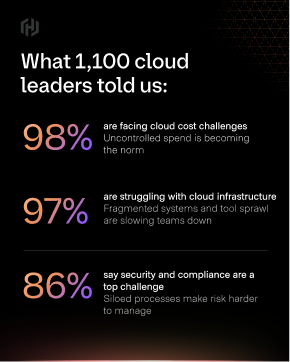
Cloud Complexity Report social post
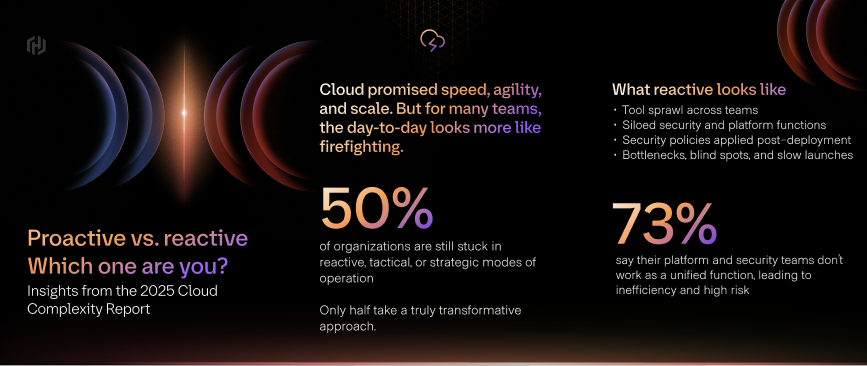
Proactive vs. reactive — which one are you?
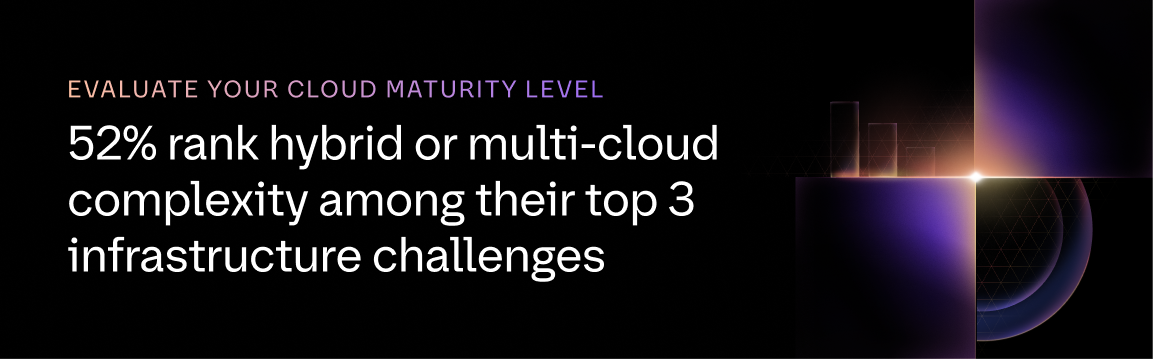
Email banner — 52% rank hybrid or multi-cloud complexity among their top 3 infrastructure challenges
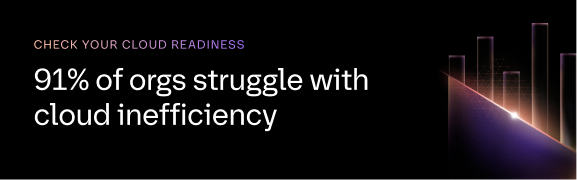
Email banner — 91% of orgs struggle with cloud inefficiency

Landing on the marketing site

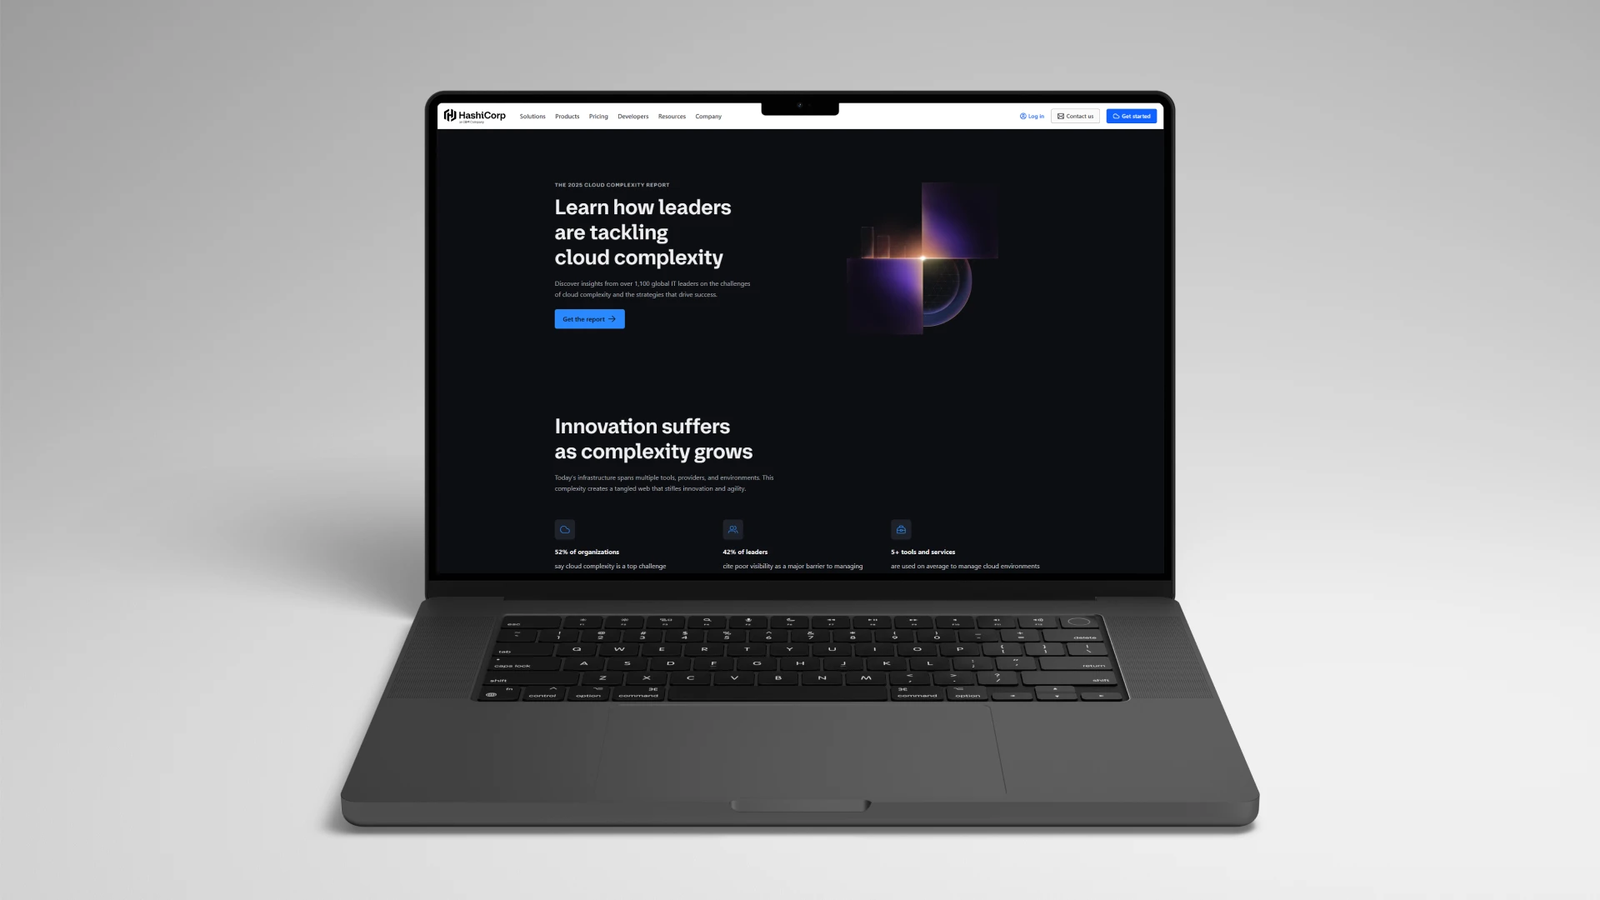
Cloud Complexity Report on the HashiCorp marketing site

Impact

60assets delivered across the campaign
11distinct asset types
190verified B2B leads generated

What I’d do next